

02 Oct Tech Blog: Monitoring Clickhouse with ELK
Here at Singulariti, we capture lots of high-frequency data of various formats. We have found that Yandex’s Clickhouse database handles our workloads particularly well.
However, the out-of-the-box Clickhouse install doesn’t provide much in the way of integrated monitoring.
There are two outputs that we are interested: Metrics and Logs. To capture and store these outputs, we will use the ELK stack (Elasticseatch-Logstash-Kibana).
First, we’ll start with the Logs. The default behaviour, is to output logs to file. This is configured in /etc/clickhouse/config.xml, see Clickhouse Server Settings – Logger:
<yandex>
    <logger>
        <level>trace</level>
        <log>/var/log/clickhouse-server/clickhouse-server.log</log>
        <errorlog>/var/log/clickhouse-server/clickhouse-server.err.log</errorlog>
        <size>1000M</size>
        <count>10</count>
    </logger>
This is not ideal, as these logs will take up disk (however, we could try to scoop these file logs up with a Filebeat container). Instead, we are going to use a syslog output
<yandex>
    <logger>
        <level>debug</level>
        <use_syslog>1</use_syslog>
        <syslog>
            <address>logstash.mydomain.com:5000</address>
            <hostname>my-clickhouse</hostname>
            <facility>LOG_USER</facility>
            <format>syslog</format>
        </syslog>
    </logger>
Next, we set up a logstash server at logstash.mydomain.com, and we start the following basic schema
input {
  syslog {
    port => 5000
  }
}
output {
    elasticsearch {
        hosts => [ "elasticsearch.mydomain.com:8192" ]
    }
}
From this, we’ll start seeing some messages come into our elasticsearch. In kibana, we see that they look like the following
message:
<15>1 2019-10-01T12:52:17.197Z my-clickhouse - 1 StorageKafka (queue_rawdata) 2019.10.01 12:52:17.197201 [ 34 ] {435345-456456} <Trace> StorageKafka (queue_rawdata): Polled batch of 1 messages
<15>1 2019-10-01T12:52:17.710Z my-clickhouse - 1 Database.table (MergerMutator) 2019.10.01 12:52:17.710887 [ 14 ] {2526246-456454} <Debug> Database.table (MergerMutator): Selected 6 parts from 20191001_223069_223074_1 to 20191001_223092_223092_0
<15>1 2019-10-01T12:52:17.715Z my-clickhouse - 1 MergeTreeSequentialBlockInputStream 2019.10.01 12:52:17.715334 [ 14 ] {4634-456456} <Trace> MergeTreeSequentialBlockInputStream: Reading 2 marks from part 20191001_223092_223092_0, total 16 rows starting from the beginning of the part
and we can see the logs from our kafka tables and mergetree. The format we can see is:
<pri>1 timestamp hostname - 1 program (subprogram?) year.month.day time [ pid ] {guid} <loglevel> program (subprogram?): message
To parse the logs of this format, we need a grok expression:
input {
  syslog {
    port => 5000
    grok_pattern => "<%{POSINT:syslog_pri}>1 %{TIMESTAMP_ISO8601:syslog_timestamp} %{SYSLOGHOST:syslog_hostname} - 1 %{NOTSPACE:program} (\(%{NOTSPACE:subprogram}\) )?%{YEAR}.%{MONTHNUM}.%{MONTHDAY} %{TIME} \[ %{POSINT:pid} \] {%{NOTSPACE}} <%{DATA:loglevel}> %{NOTSPACE}( \(%{NOTSPACE}\))?: %{GREEDYDATA:syslog_message}"
  }
}
We want to use the hostname and message and timestamp in the message, instead of the one generated by Logstash, so we include a filter:
filter {
    mutate {
        copy => { "syslog_hostname" => "host" }
        copy => { "syslog_message" => "message" }
        lowercase => [ "loglevel" ]
    }
    date {
        # sync the clickhouse message time with the logstash time.
        # Format: 2019-10-01T14:07:58.062Z
        # locale => "en"
        # timezone => "UTC"
        match => [ "syslog_timestamp", "yyyy-MM-dd'T'HH:mm:ss.SSSZ"]
    }
}
Lastly, we want to remove any fields that arent useful to us
    mutate {
        remove_field => [ "syslog_hostname" ,"syslog_timestamp", "syslog_message", "severity", "severity_label", "facility" ,"priority", "facility_label", "syslog_pri" ]
    }
Combining all this, we arrive at our final Logstash config:
input {
  syslog {
    port => 5000
    grok_pattern => "<%{POSINT:syslog_pri}>1 %{TIMESTAMP_ISO8601:syslog_timestamp} %{SYSLOGHOST:syslog_hostname} - 1 %{NOTSPACE:program} (\(%{NOTSPACE:subprogram}\) )?%{YEAR}.%{MONTHNUM}.%{MONTHDAY} %{TIME} \[ %{POSINT:pid} \] {} <%{DATA:loglevel}> %{NOTSPACE}( \(%{NOTSPACE}\))?: %{GREEDYDATA:syslog_message}"
  }
}
filter {
    mutate {
        copy => { "syslog_hostname" => "host" }
        copy => { "syslog_message" => "message" }
        lowercase => [ "loglevel" ]
    }
    ## uncomment enable syslog_pri parsing
    # syslog_pri { }
    date {
        # sync the clickhouse message time with the logstash time.
        # Format: 2019-10-01T14:07:58.062Z
        # locale => "en"
        # timezone => "UTC"
        match => [ "syslog_timestamp", "yyyy-MM-dd'T'HH:mm:ss.SSSZ"]
    }
    mutate {
        remove_field => [ "syslog_hostname" ,"syslog_timestamp", "syslog_message", "severity", "severity_label", "facility" ,"priority", "facility_label", "syslog_pri" ]
    }
}
output {
    elasticsearch {
        hosts => [ "elasticsearch.mydomain.com:8192" ]
    }
}
With this we can visualize our beautiful logs in Kibana.

Next, for the metrics, we use the graphite exporter in Clickhouse ,see Clickhouse Server Settings – Graphite. From /etc/clickhouse/config.xml:
<yandex>
    <graphite>
        <host>logstash.mydomain.com</host>
        <port>42000</port>
        <timeout>10</timeout>
        <interval>30</interval>
        <root_path>my-clickhouse</root_path>
        <metrics>true</metrics>
        <events>false</events>
        <asynchronous_metrics>false</asynchronous_metrics>
    </graphite>
This will poll the internal metrics table every 30 seconds, and send the data to Logstash. we create a seperate Logstash pipeline for these messages.
# graphite.cfg
input {
    graphite {
        type => graphite
        id => clickhouse
        mode => server
        port => 42000
    }
}
output {
    elasticsearch {
        hosts => [ "elasticsearch.mydomain.com:8192" ]
        index =>  "metricbeat-7.2.0"
    }
}
Here we are explicitly sending these messages to the metricbeat-* elasticsearch index. However, these graphite messages all come as a huge text block, and we’ll need to split up the message block. The general formal of this multiline message block is
hostname.id.ClickHouse.metricset.metric value max
hostname.id.ClickHouse.metricset.metric value max
hostname.id.ClickHouse.metricset.metric value max
...
To split this up, we are going to have to use a custom block of ruby code:
# graphite.cfg
input {
    graphite {
        type => graphite
        id => clickhouse
        mode => server
        port => 42000
    }
}
filter {
    # first clean out all the other fields we dont need
    prune {
        whitelist_names => ["^message$","type","timestamp","id"]
    }
    # custom ruby code block
    ruby {
        code => '
        # split the block into lines
        messages = event.get("\[message\]").split("\n")
        header_set = false
        messages.each { |message|
            # split the line into the three pieces
            blocks = message.split(" ")
            next if blocks.length != 3
            # split the first piece by . (should have 5)
            metric_full = blocks[0].split(".")
            next if metric_full.length != 5
            if ! header_set
                # if this is the first line, extract the meta information
                event.set("[host][name]", "#{metric_full[0]}")
                event.set("[agent][name]", "#{metric_full[0]}")
                event.set("[agent][hostname]", "#{metric_full[1]}")
                event.set("[agent][id]", "#{metric_full[1]}")
                event.set("[event][dataset]", "#{metric_full[2]}.#{metric_full[3]}")
                event.set("[event][module]", "#{metric_full[2]}")
                event.set("[metricset][name]", "#{metric_full[3]}")
                header_set = true
            end
            # for every line, add a field corresponding to the full metric, blocks[1] is the value
            event.set("[#{metric_full[2]}][#{metric_full[3]}][#{metric_full[4]}]", blocks[1].to_i )
        }
        # add in some more meta
        event.set("[event][module]","graphite")
        event.set("[agent][type]", "metricbeat")
        '
    }
    # remove the original big message block
    mutate {
        remove_field => [ "message"]
    }
}
output {
    elasticsearch {
        hosts => [ "elasticsearch.mydomain.com:8192" ]
        index =>  "metricbeat-7.2.0"
    }
}
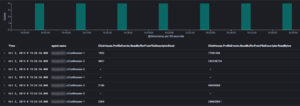
A lot of the fields we added in are required for the metricbeat index to function properly. We can now explore our metrics in Kibana.
In a follow-up post, I’ll discuss how to create elegant dashboards for all this new information.
Paul
Posted at 03:43h, 04 Juneyou could have stood up a smaller monitoring clickhouse cluster to store its telemetry and logs..
Singulariti
Posted at 09:01h, 04 JuneAbsolutely, however we use ELK for the rest of our log aggregation so this was a natural integration.